FlowHigh SQL Visualiser
Visualise SQL
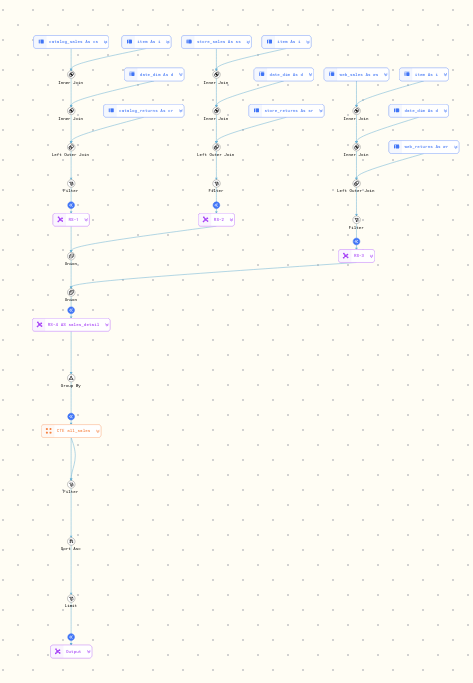
Visualise SQL gives you a visual representation of your SQL code. This can be useful to navigate and understand complex and nested SQL. It is also useful for documentation purposes.
Sample queries
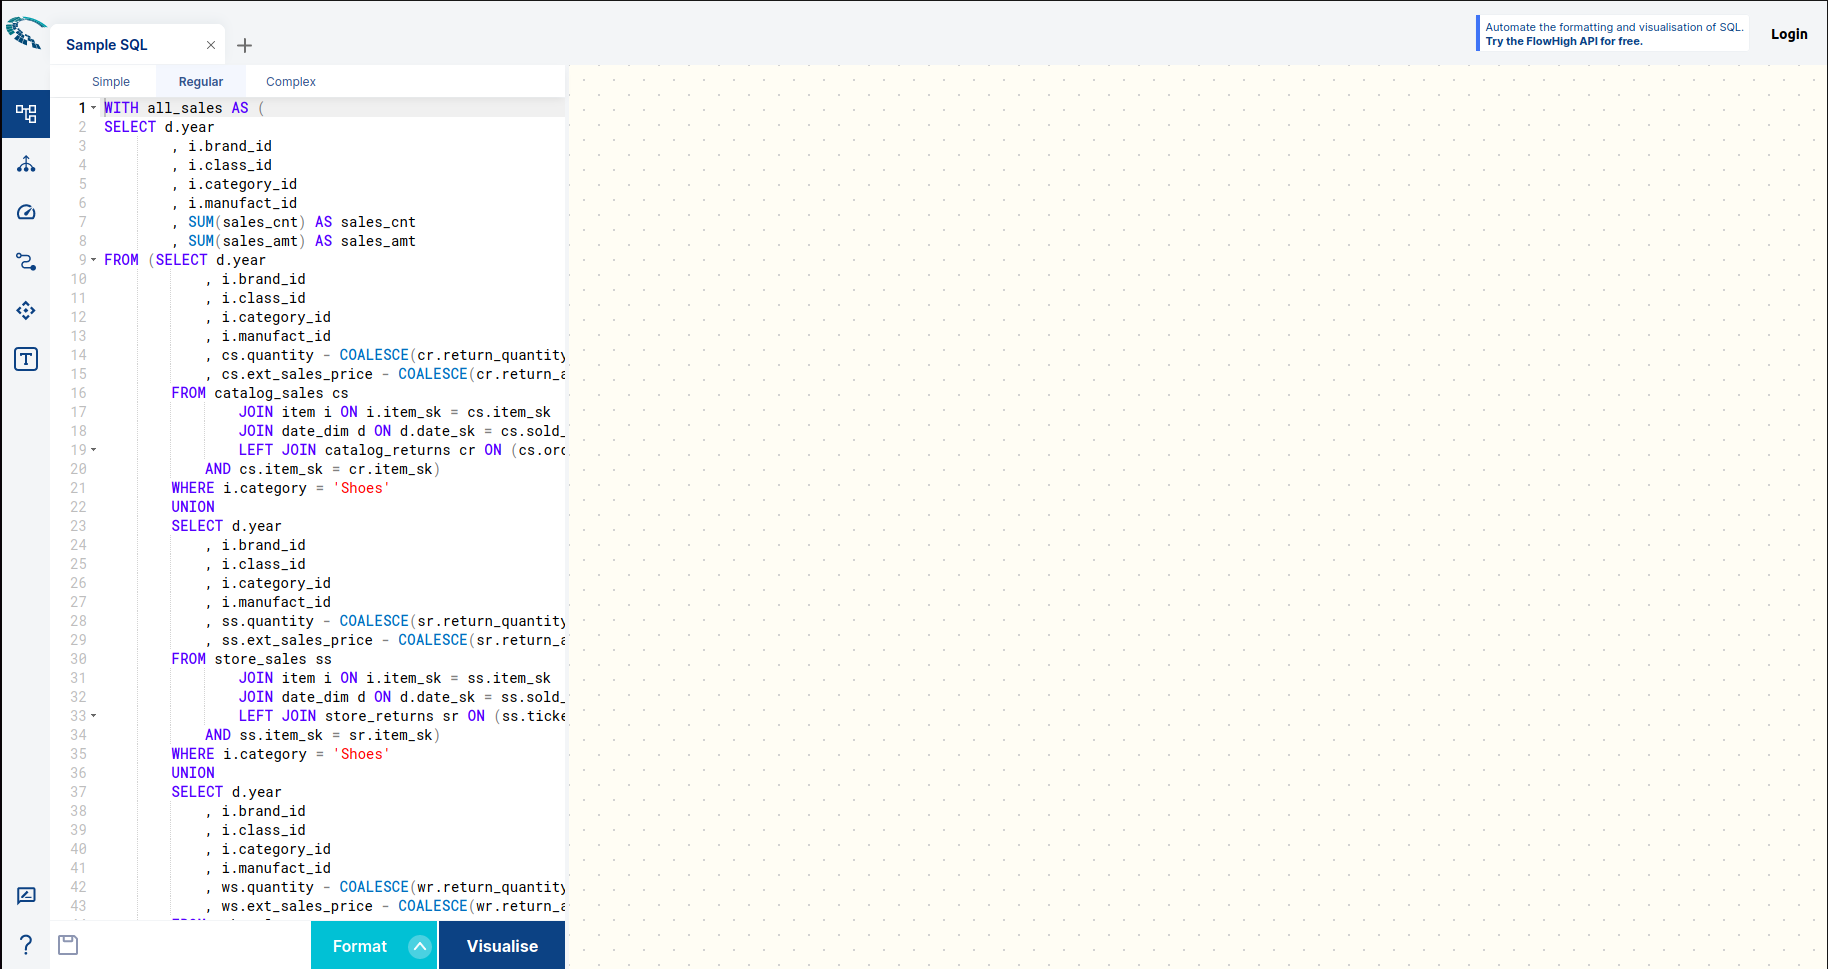
There are 3 sample queries that we offer. They represent different variations of query complexity. There are Simple, Regular and Complex queries. Sample queries could be visualised, formatted and parsed without a need to login. We can use sample queries to see features of FlowHigh (SQL Visualiser, SQL Parser, SQL Formatter) without a need to create your own queries, which can speed up the process of checking FlowHigh and deciding if it suits your needs. To run your queries, account registration is needed. Visualising sample queries can be done with 2 simple clicks. You just need to select which one of the sample queries you want to visualise, click on it and then click on the Visualise button.
Select Sample Query and click on it
Visualise Sample query
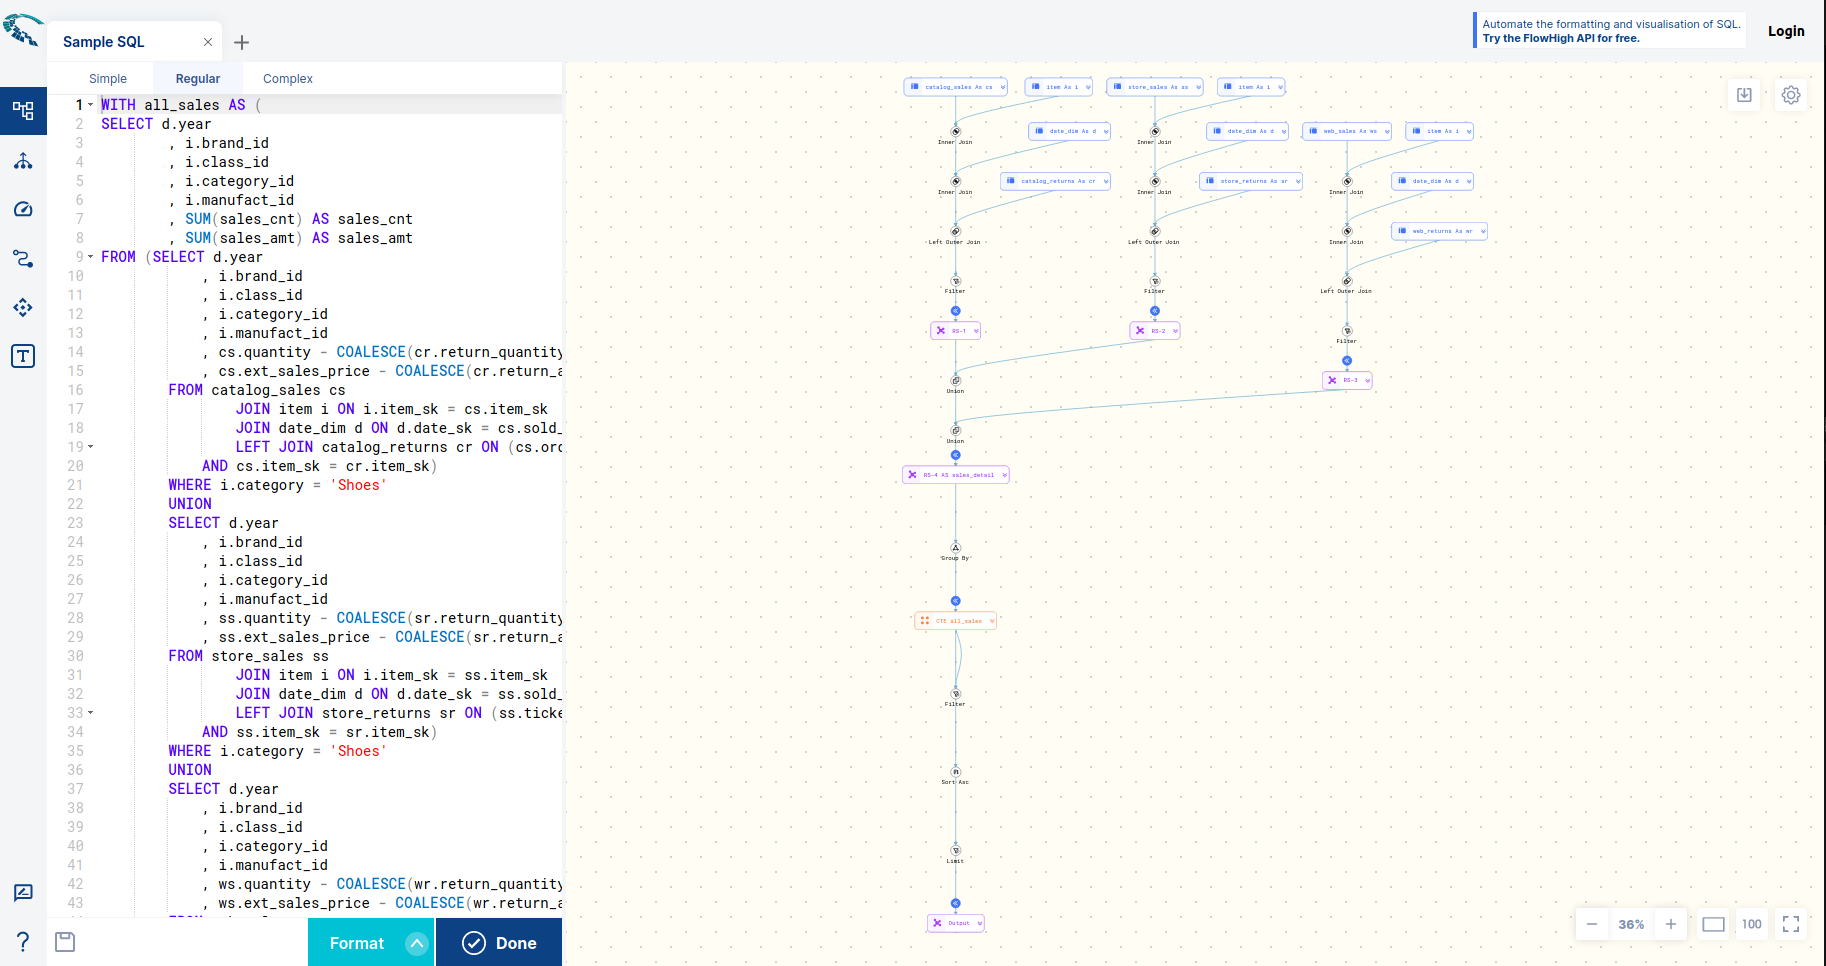
After visualising sample query you are also able to get the list of tables and understand the diagram better.
Understanding the visual diagram
Table types
| Type | Icon |
|---|---|
| Physical Table |  |
| Inline view tables |  |
| Recursive Tables |  |
| Common Table Expressions |  |
| Function Table |  |
| Pseudo tables |  |
| Operators | |
| Join | Icon |
| Inner Join | |
| Left (Outer) Join | |
| Right (Outer) Join | |
| Full (Outer) Join | |
| Cross Join | |
| Pivot | |
| Unpivot | |
| Set operations | |
| Union | |
| Union All | |
| Except | |
| Intersect | |
| Minus | |
| Match Recognize | |
| Sample | |
| Filter | |
| WHERE | |
| HAVING | |
| QUALIFY | |
| ORDER BY | |
| Descending | |
| Ascending | |
| Asc and Desc | |
| GROUP BY | |
| Pagination | |
| Limit | |
| Fetch | |
| Top |
Navigating the visual diagram
Zoom
To better see table names, column and operators diagram can be zoomed in, and also zoomed out for better understanding of the query

Highlight table and code
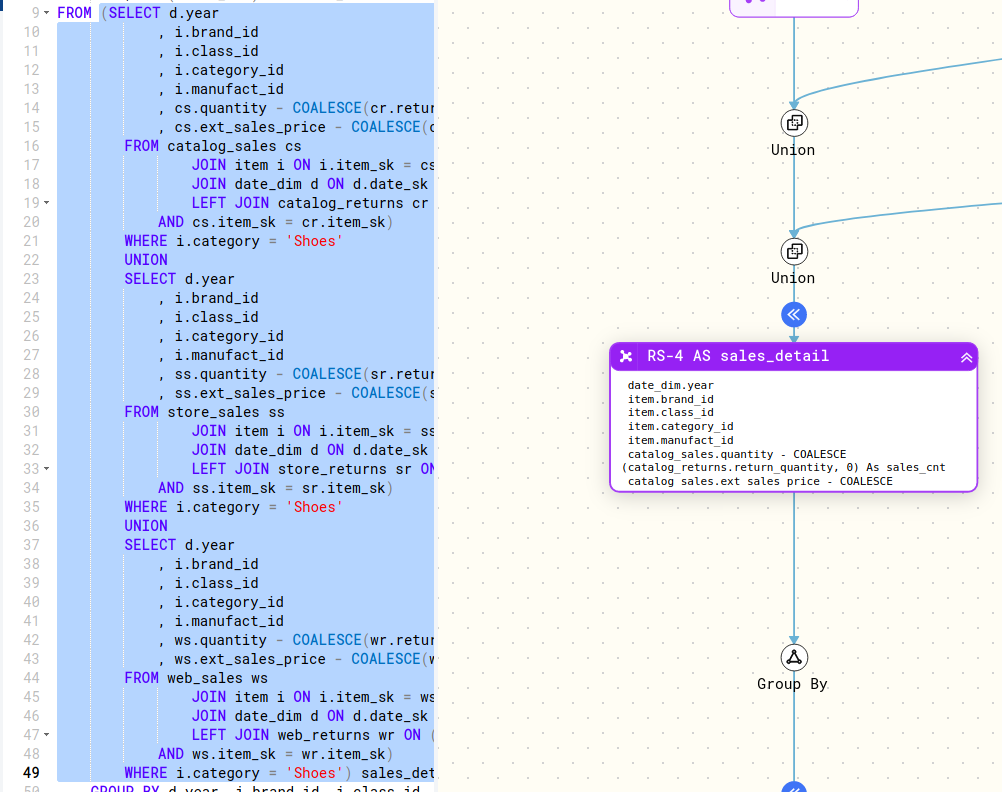
Diagram offers an ability to select a table, which will highlight a code and see what part of the query was used for that particular table.
Expand / collapse SQL tree
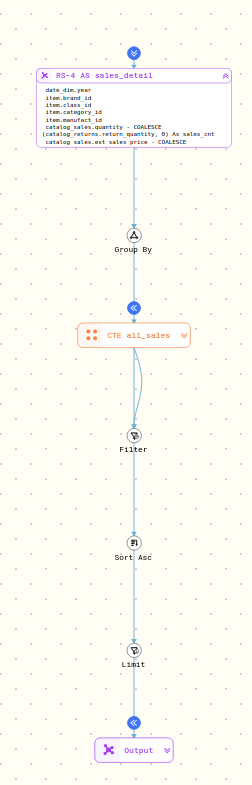
In the diagram we also have an option to expand / collapse the SQL tree. Which could be useful for complex diagrams, where there is a large number of tables, and we would like to reduce the number of tables in a diagram.
Expand / collapse table columns
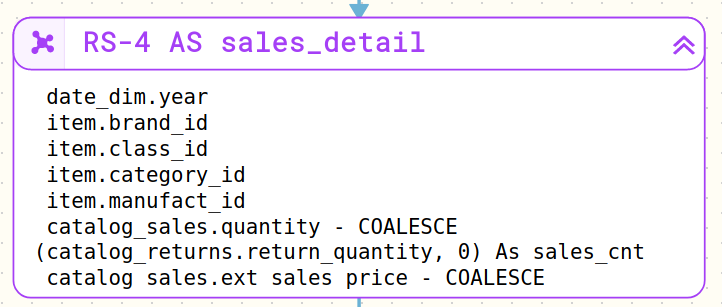
You can also expand or collapse tables to see which columns are used in the query for those specific tables.
Hover (mouse over)
For a quick look at which columns are used you can hover over a table.
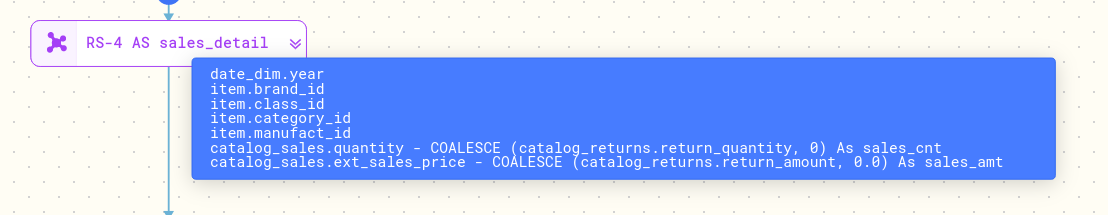
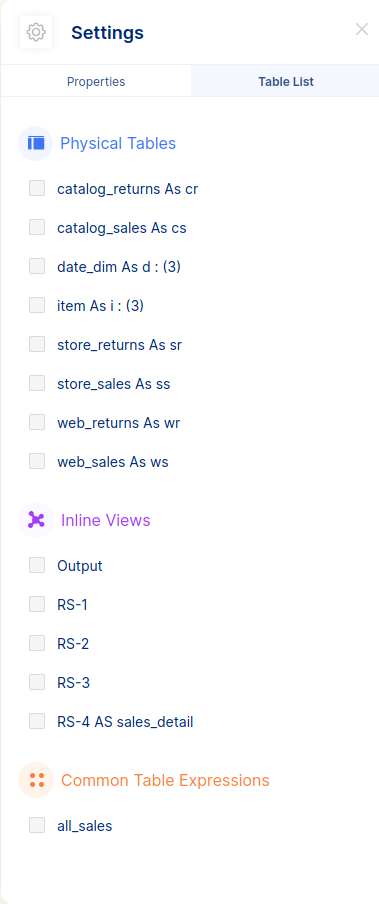
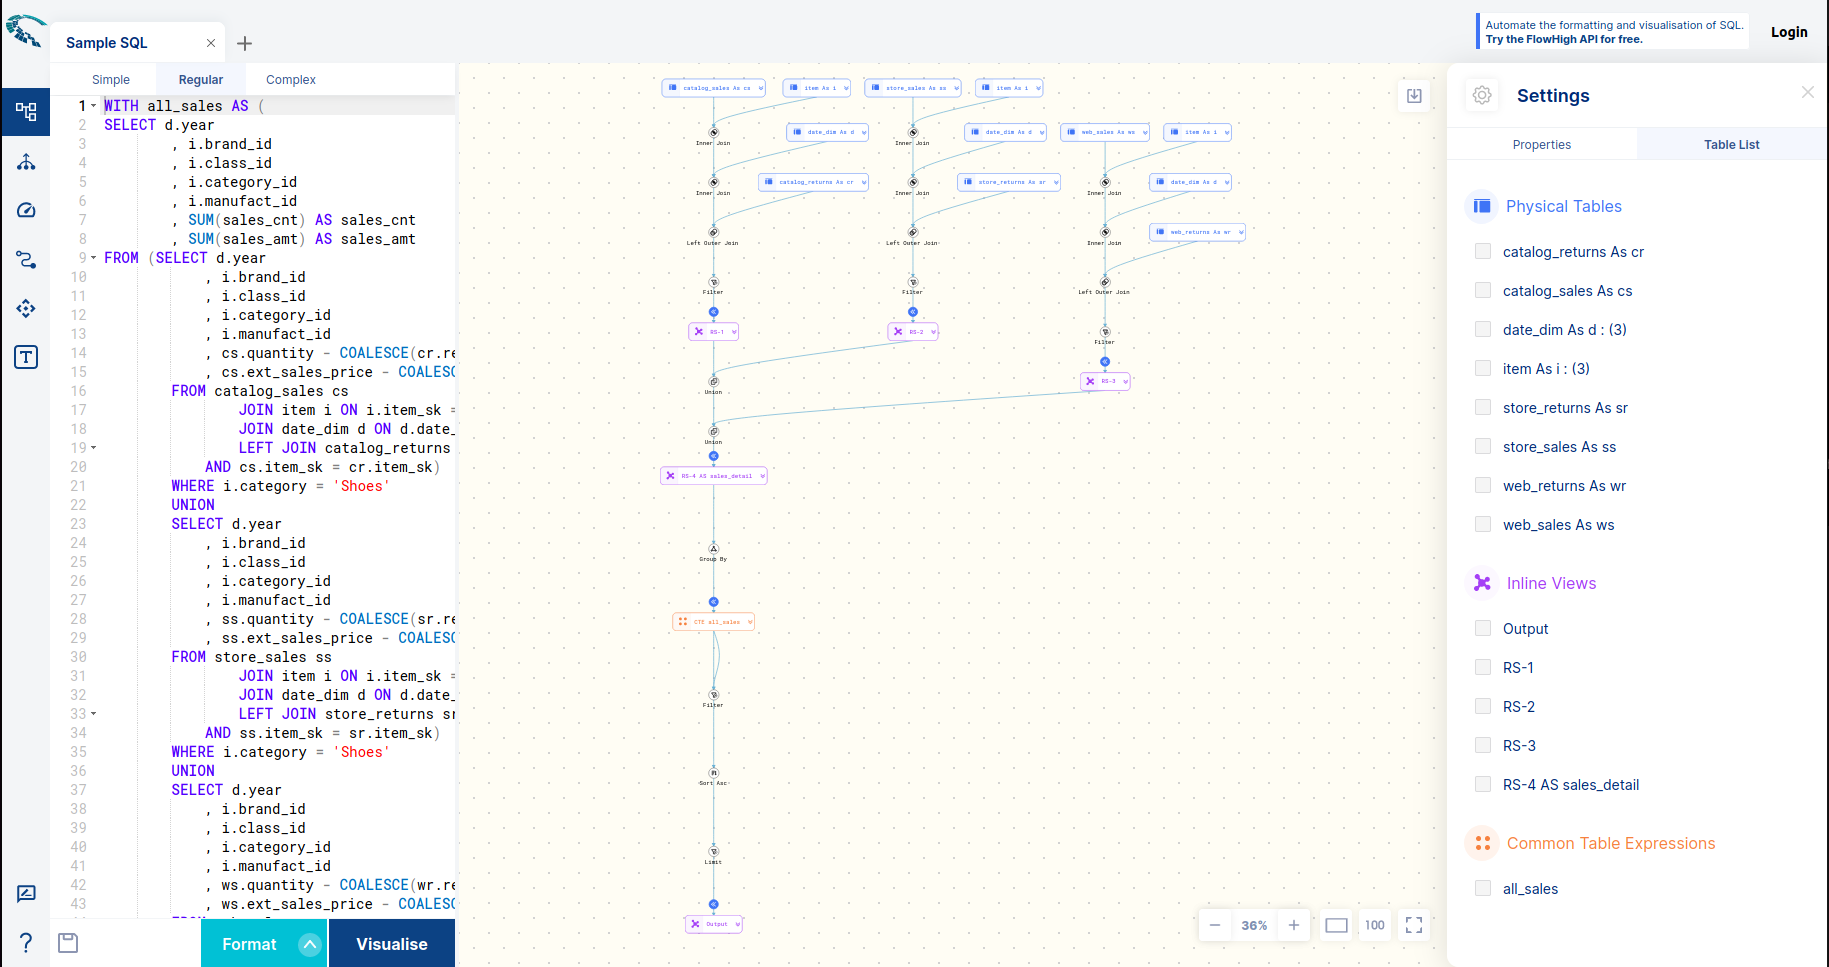
Diagram properties
When the query gets visualised, a diagram properties icon will show up. Diagram properties allows you to go through the table list and see all the tables and table types created with the query.